eyeris:
Flexible, Extensible, & Reproducible Pupillometry Preprocessing
eyeris:
Flexible, Extensible, & Reproducible Pupillometry Preprocessing

![]()
![]()
![]()
![]()
![]()
![]()
Dive deeper into eyeris’ development and operational
insights with our new
eyeris
DevOps Dashboard!
Despite decades of pupillometry research, many established packages
and workflows unfortunately lack design principles based on
(F)indability (A)ccessbility (I)nteroperability (R)eusability (FAIR)
principles. eyeris, on the other hand follows a thoughtful
design philosophy that results in an intuitive, modular, performant, and
extensible pupillometry data preprocessing framework. Much of these
design principles were heavily inspired by Nipype.
eyeris also provides a highly opinionated pipeline for
tonic and phasic pupillometry preprocessing (inspired by
fMRIPrep). These opinions are the product of many hours of
discussions from core members and signal processing experts from the
Stanford Memory Lab (Shawn Schwartz, Mingjian He, Haopei Yang, Alice
Xue, and Anthony Wagner).
eyeris also introduces a BIDS-like
structure for organizing derivative (preprocessed) pupillometry data, as
well as an intuitive workflow for inspecting preprocessed pupillometry
epochs within beautiful, interactive HTML report files (see
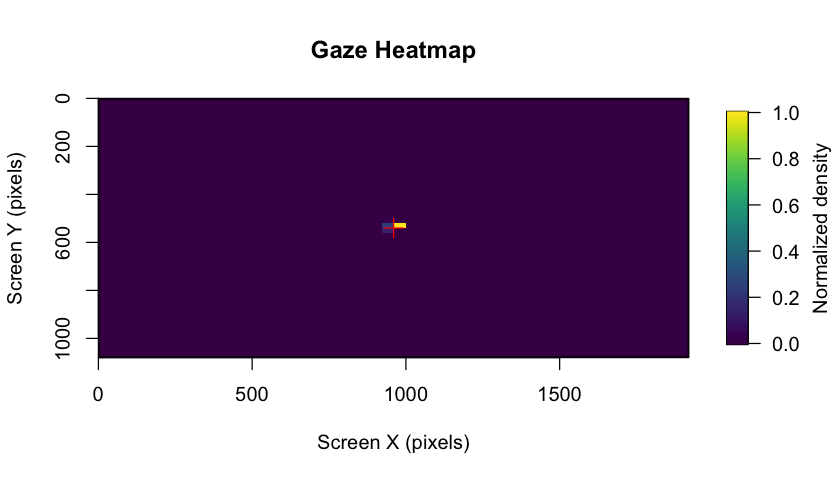
demonstration below ⬇)! The package also includes gaze heatmaps that
show the distribution of eye coordinates across the entire screen area,
helping you assess data quality and participant attention patterns.
These heatmaps are automatically generated in the BIDS reports and can
also be created manually.
The current version of eyeris reads data recorded with
SR Research EyeLink eye-trackers (via the
.asc files produced by the EyeLink edf2asc
converter). EyeLink remains the most widely used research-grade system
in the pupillometry community, so we focused our initial efforts there
to ensure a robust, well-tested foundation.
That said, eyeris is designed from the ground up to be
format-agnostic downstream of data loading: every
preprocessing step operates on a standardized internal
eyeris object rather than on raw EyeLink files. This means
support for additional open-source and vendor eye-tracker formats (e.g.,
Pupil Labs, Tobii, GazePoint, and the emerging BIDS Eye Tracking
specification) can be added by writing a new data-loading function that
maps raw samples and event messages onto the same internal
representation — no changes to the preprocessing pipeline are
required.
Roadmap & community contributions. Broadening native support for other tracker formats is on our roadmap, and we actively welcome community contributions of new loaders. If you would like to help add support for your tracker of choice, please open an issue or pull request — see the contribution guidelines to get started.
📦 Modular Design: Each preprocessing step is a
standalone function that can be used independently or combined into
custom pipelines.🔍 Interactive Reports: Beautiful, interactive HTML
reports that summarize preprocessing steps and visualize data
quality.🔄 Flexible Extensions: Easily create custom extensions
to the preprocessing pipeline by writing your own functions and adding
them to the pipeline.📊 Data Quality Assessment: Automatically generated
figures of each preprocessing step and its effect on the pupil signal
(at the global and trial levels), as well as gaze heatmaps and binocular
correlation plots to assess data quality and participant attention
patterns.🗂️ BIDS-like File Structure: Organizes preprocessed
data using a BIDS-like directory structure that supports both monocular
and binocular eye-tracking data.📝 Logging Commands: Automatically capture all console
output and errors to timestamped log files.
Below is a table of all main eyeris functions, organized
by feature, with links to their documentation and a brief
description.
| Feature | Function Documentation | Description |
|---|---|---|
| Pipeline Orchestration | glassbox() | Run the full recommended preprocessing pipeline with a single function call. |
| BIDSify | bidsify() | Create a BIDS-like directory structure for preprocessed data as well as interactive HTML reports for data and signal processing provenance. |
| Data Loading | load_asc() | Load EyeLink .asc files into an eyeris
object. |
| Blink Artifact Removal | deblink() | Remove blink artifacts by extending and masking missing samples. |
| Transient (Speed-Based) Artifact Removal | detransient() | Remove transient spikes in the pupil signal using a moving MAD filter. |
| Linear Interpolation | interpolate() | Interpolate missing (NA) samples in the pupil signal. |
| Lowpass Filtering | lpfilt() | Apply a Butterworth lowpass filter to the pupil signal. |
| Downsampling | downsample() | Downsample the pupil signal to a lower sampling rate. |
| Binning | bin() | Bin pupil data into specified time bins using mean or median. |
| Detrending | detrend() | Remove slow drifts from the pupil signal by linear detrending. |
| Z-scoring | zscore() | Z-score the pupil signal within each block. |
| Confound Summary | summarize_confounds() | Summarize and visualize confounding variables for each preprocessing step. |
| Epoching & Baselining | epoch() | Extract time-locked epochs from the continuous pupil signal. |
| Plotting | plot() | Plot the pupil signal and preprocessing steps. |
| Gaze Heatmaps | plot_gaze_heatmap() | Generate heatmaps of gaze position across the screen. |
| Binocular Correlation | plot_binocular_correlation() | Compute correlation between left and right eye pupil signals. |
| Demo (Monocular) Dataset | eyelink_asc_demo_dataset() | Load a demo monocular recording EyeLink dataset for testing and examples. |
| Demo (Binocular) Dataset | eyelink_asc_binocular_demo_dataset() | Load a demo binocular recording EyeLink dataset for testing and examples. |
| Logging Commands | eyelogger() | Automatically capture all console output and errors to timestamped log files. |
| Database Storage | eyeris_db_collect() | High-performance database storage and querying alternative to CSV files. |
| Database Summary | eyeris_db_summary() | Get comprehensive overview of database contents and metadata. |
| Database Connection | eyeris_db_connect() | Connect to eyeris databases for custom queries and operations. |
| Database Export (Chunked) | eyeris_db_to_chunked_files() | Export large databases in configurable chunks with automatic file size limits. |
| Database Export (Parquet) | eyeris_db_to_parquet() | Export database to high-performance Parquet format files. |
| Read Parquet Files | read_eyeris_parquet() | Read and combine eyeris Parquet files with schema-aligned binding. |
| Database Sharing (Split) | eyeris_db_split_for_sharing() | Split databases into chunks for easier sharing and collaboration. |
| Database Sharing (Reconstruct) | eyeris_db_reconstruct_from_chunks() | Reconstruct complete databases from shared chunks. |
| Custom Extensions | See vignette: Custom Extensions | Learn how to write your own pipeline steps and integrate them with
eyeris. |
| Internal API Reference | See vignette: Internal API Reference | Comprehensive documentation of all internal functions for advanced users and developers. |
For a full list of all functions, see the eyeris reference index.
eyeris ObjectYou can install the stable release of eyeris
from CRAN with:
install.packages("eyeris")or
# install.packages("pak")
pak::pak("eyeris")You can install the development version of eyeris from
GitHub with:
# install.packages("devtools")
devtools::install_github("shawntz/eyeris", ref = "dev")eyeris offers optional high-performance database storage
(via DuckDB) and parquet file I/O (via Arrow)
as alternatives to CSV files. These packages are not
required for core functionality but provide significant
performance benefits for large-scale analyses.
The duckdb package enables efficient storage and
querying of large datasets. Required for
bidsify(..., db_enabled = TRUE) and all
eyeris_db_* functions:
install.packages("duckdb")Platform-specific notes:
install.packages("duckdb", type = "binary")sudo apt-get install r-cran-duckdb) or install from
CRANinstall.packages("duckdb")The arrow package provides high-performance parquet file
I/O for functions like eyeris_db_to_parquet(),
read_eyeris_parquet(), and related export/import
operations. When not available, eyeris automatically falls
back to DuckDB for parquet operations (slower but functional).
macOS users: Arrow requires system dependencies via Homebrew:
# Install system dependencies first
brew update
brew install pkg-config cmake apache-arrow

# Then install the R packageinstall.packages("arrow", type = "binary")Linux users (Ubuntu/Debian):
# Install system dependencies
sudo apt-get update
sudo apt-get install -y libcurl4-openssl-dev libssl-devinstall.packages("arrow")Linux users (Fedora/RHEL):
# Install system dependencies
sudo dnf install libcurl-devel openssl-develinstall.packages("arrow")Windows users:
install.packages("arrow")For more details, see the Arrow R documentation.
Note: When you load
eyeris, startup messages will inform you if DuckDB or Arrow are not installed and provide detailed platform-specific installation instructions. You can also access these instructions anytime via?check_duckdband?check_arrow. Once installed, restart R and reloadeyeristo enable these features.
Minimum requirements:
Recommended for large datasets:
bidsify(), especially for datasets with many epochs or long
recordingsNote: HTML report generation uses
pandocinternally viarmarkdown. Large preprocessing pipelines with many epochs may require additional memory during report rendering.
glassbox()
“prescription” functionThis is a basic example of how to use eyeris out of the
box with our very opinionated set of steps and parameters that
one should start out with when preprocessing pupillometry data.
Critically, this is a “glassbox” – as opposed to a “blackbox” – since
each step and parameter implemented herein is fully open and accessible
to you. We designed each pipeline step / function to be like a LEGO
brick – they are intentionally and carefully designed in a way that
allows you to flexibly construct and compare different pipelines.
We hope you enjoy! -Shawn
set.seed(32)
library(eyeris)
#>
#> eyeris v3.1.0 - Lumpy Space Princess ꒰•ᴗ•。꒱۶
#> Welcome! Type ?`eyeris` to get started.
#> ** DuckDB not found. Database features are disabled.
#>
#> => To install DuckDB:
#> - macOS: install.packages('duckdb', type = 'binary')
#> - Linux: use system packages (e.g., `sudo apt-get install r-cran-duckdb`)
#> or install.packages('duckdb') if binaries are available
#> - Windows: install.packages('duckdb')
#>
#> Once installed, restart R and reload eyeris to enable database storage
#> (bidsify(..., db_enabled = TRUE) and eyeris_db_* functions).
#> ** Arrow not found. Parquet operations will use DuckDB fallback (slower).
#>
#> => To install Arrow:
#>
#> - macOS:
#> 1. First install system dependencies with Homebrew:
#> brew update
#> brew install pkg-config cmake apache-arrow
#> 2. Then install the R package:
#> install.packages('arrow', type = 'binary')
#>
#> - Linux (Ubuntu/Debian):
#> 1. Install system dependencies:
#> sudo apt-get update
#> sudo apt-get install -y libcurl4-openssl-dev libssl-dev
#> 2. Then install the R package:
#> install.packages('arrow')
#>
#> - Linux (Fedora/RHEL):
#> 1. Install system dependencies:
#> sudo dnf install libcurl-devel openssl-devel
#> 2. Then install the R package:
#> install.packages('arrow')
#>
#> - Windows:
#> install.packages('arrow')
#>
#> For more details, see: https://arrow.apache.org/docs/r/
#>
#> Once installed, restart R and reload eyeris to enable faster parquet export/import
#> (eyeris_db_to_parquet(), read_eyeris_parquet(), and related functions).
demo_data <- eyelink_asc_demo_dataset()
eyeris_preproc <- glassbox(
demo_data,
lpfilt = list(plot_freqz = FALSE)
)
#> ✔ [2026-06-05 00:01:48] [OKAY] Running eyeris::load_asc()
#> ℹ [2026-06-05 00:01:48] [INFO] Processing block: block_1
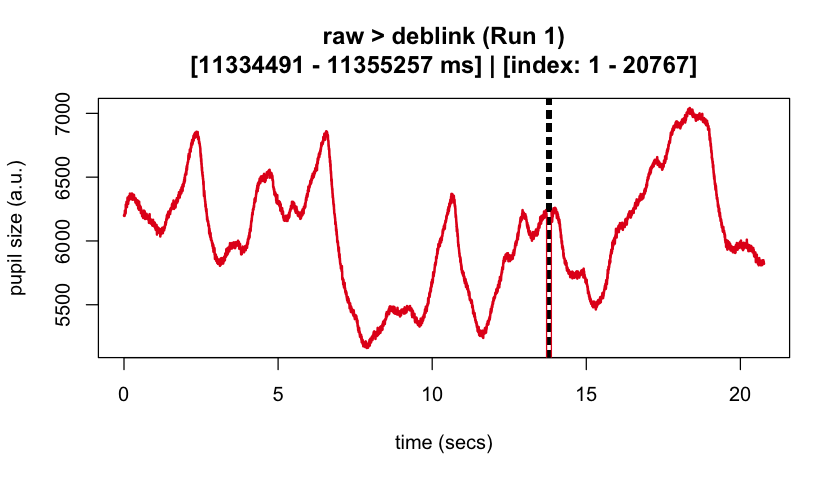
#> ✔ [2026-06-05 00:01:48] [OKAY] Running eyeris::deblink() for block_1
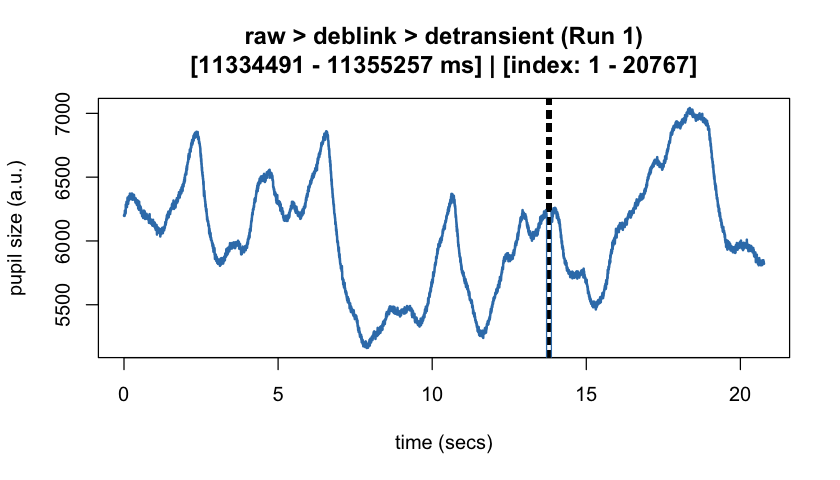
#> ✔ [2026-06-05 00:01:48] [OKAY] Running eyeris::detransient() for block_1
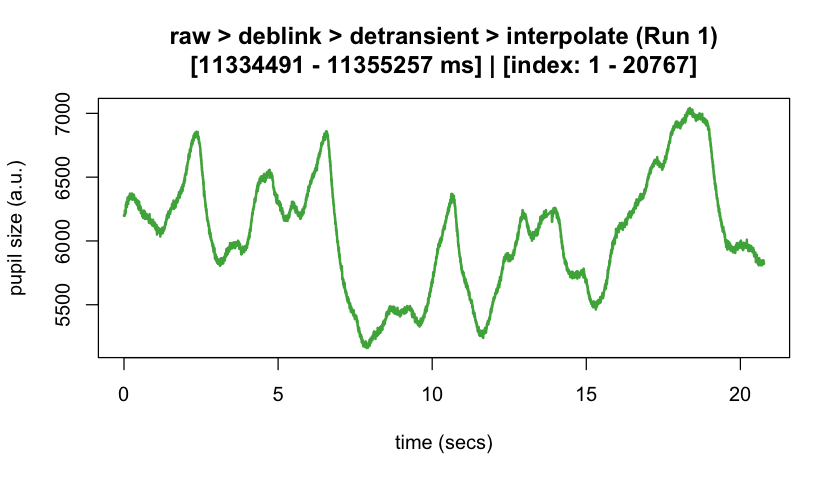
#> ✔ [2026-06-05 00:01:48] [OKAY] Running eyeris::interpolate() for block_1
#> ✔ [2026-06-05 00:01:48] [OKAY] Running eyeris::lpfilt() for block_1
#> ! [2026-06-05 00:01:48] [WARN] Skipping eyeris::downsample() for block_1
#> ! [2026-06-05 00:01:48] [WARN] Skipping eyeris::bin() for block_1
#> ! [2026-06-05 00:01:48] [WARN] Skipping eyeris::detrend() for block_1
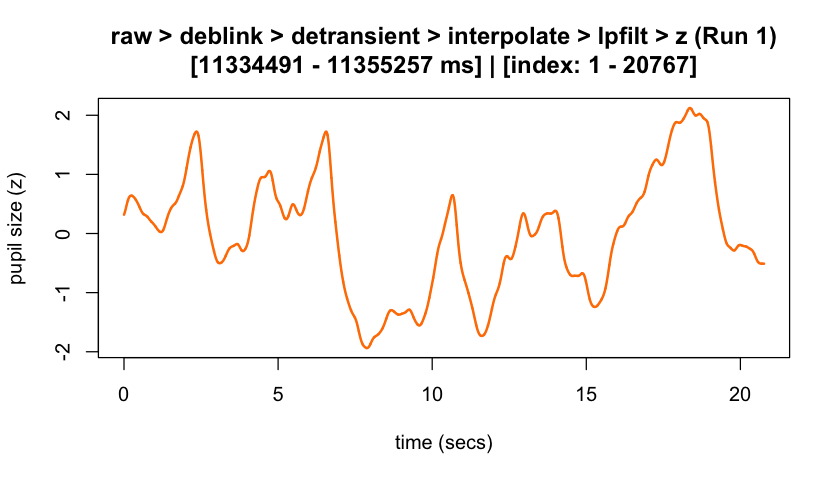
#> ✔ [2026-06-05 00:01:48] [OKAY] Running eyeris::zscore() for block_1
#> ℹ [2026-06-05 00:01:48] [INFO] Block processing summary:
#> ℹ [2026-06-05 00:01:48] [INFO] block_1: OK (steps: 6, latest:
#> pupil_raw_deblink_detransient_interpolate_lpfilt_z)
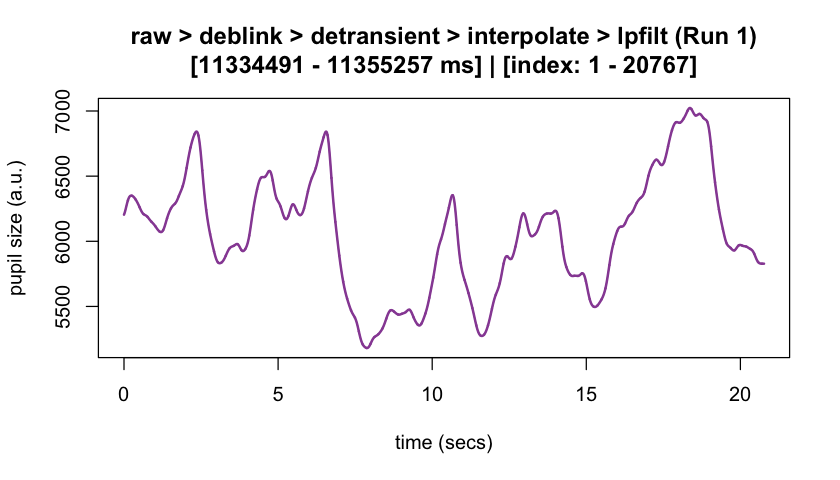
#> ✔ [2026-06-05 00:01:48] [OKAY] Running eyeris::summarize_confounds()plot(eyeris_preproc, add_progressive_summary = TRUE)

start_time <- min(eyeris_preproc$timeseries$block_1$time_secs)
end_time <- max(eyeris_preproc$timeseries$block_1$time_secs)

plot(eyeris_preproc,
  # steps = c(1, 5), # uncomment to specify a subset of preprocessing steps to plot; by default, all steps will plot in the order in which they were executed by eyeris
  preview_window = c(start_time, end_time),
  add_progressive_summary = TRUE
)
#> ℹ [2026-06-05 00:01:48] [INFO] Plotting block 1 with sampling rate 1000 Hz from
#> possible blocks: 1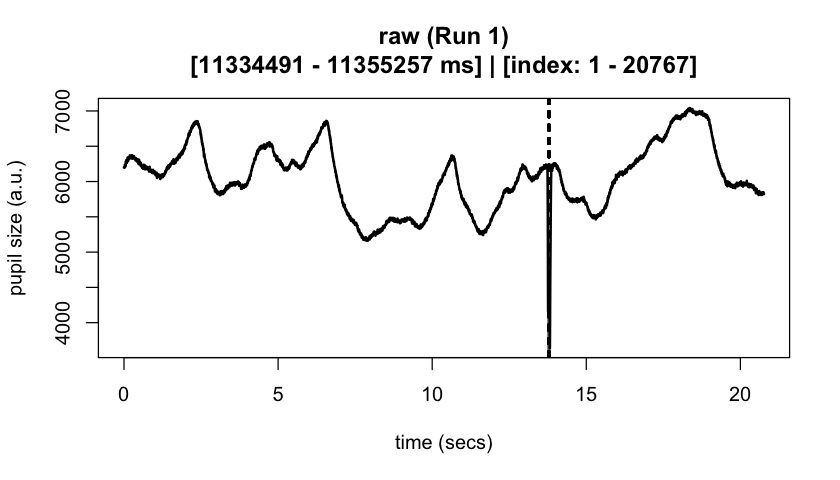
#> ℹ [2026-06-05 00:01:48] [INFO] Creating progressive summary plot for block_1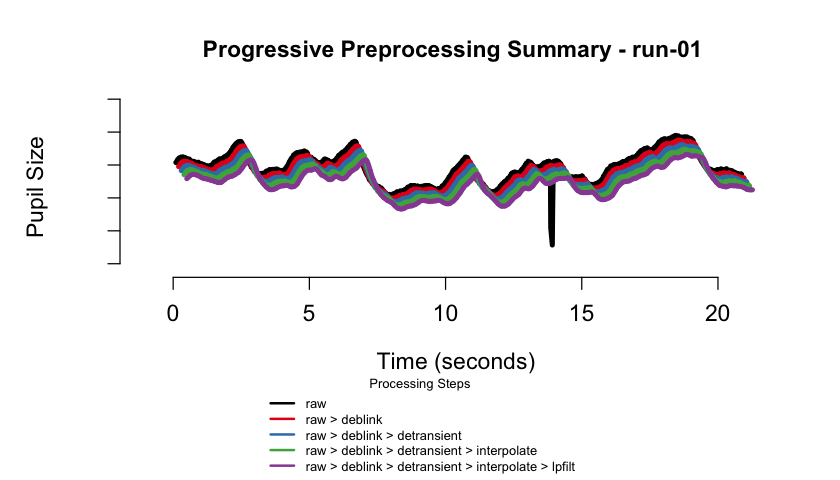
#> ✔ [2026-06-05 00:01:49] [OKAY] Progressive summary plot created successfully!

plot_gaze_heatmap(
  eyeris = eyeris_preproc,
  block = 1
)
eyeris includes powerful database functionality powered
by DuckDB that provides a scalable, efficient alternative
to CSV file storage. This is especially valuable for large studies,
cloud computing, and collaborative research projects.
🚀 Performance at Scale - Handle hundreds of
subjects efficiently vs. managing thousands of CSV files - Faster
queries: filter and aggregate at the database level instead of loading
all data into R - Reduced memory usage: load only the data
you need
💯 Cloud Computing Optimized - Reduce I/O costs on AWS, GCP, Azure - Single database file vs. thousands of CSV files for data transfer - Bandwidth efficient and cost-effective for large datasets
🔒 Data Integrity - Built-in schema validation prevents data corruption - Automatic metadata tracking and timestamps
eyeris Project Database CreationEnable eyeris project database storage alongside or
instead of CSV files:
bidsify(
  processed_data,
  bids_dir = "~/my_study",
  participant_id = "001",
  session_num = "01",
  task_name = "memory_task",
  csv_enabled = TRUE,    # keep traditional BIDS-style CSV output files
  db_enabled = TRUE,     # but also create an eyeris project database
  db_path = "study_database"
)

bidsify(
  processed_data,
  bids_dir = "~/my_study",
  participant_id = "001",
  session_num = "01",
  task_name = "memory_task",
  csv_enabled = FALSE,   # skip CSV creation
  db_enabled = TRUE,     # cloud-optimized: Database only (no CSV files)
  db_path = "study_database"
)Extract all your data with one function call:
# extract ALL data for ALL subjects
all_data <- eyeris_db_collect("~/my_study", "study_database")

# access specific data types
timeseries_data <- all_data$timeseries
confounds_data <- all_data$run_confounds

# targeted extraction: specific subjects and data types
subset_data <- eyeris_db_collect(
  "~/my_study",
  "study_database",
  subjects = c("001", "002", "003"),
  data_types = c("timeseries", "epochs", "confounds_summary")
)# get a comprehensive database summary
summary <- eyeris_db_summary("~/my_study", "study_database")
summary$subjects # all subjects in database
summary$data_types # available data types
summary$total_tables # number of tables
# connect to eyeris database for custom operations
con <- eyeris_db_connect("~/my_study", "study_database")
# ... custom SQL queries ...
eyeris_db_disconnect(con)💡 Pro Tip: Use
csv_enabled = FALSE, db_enabled = TRUEfor cloud computing to maximize efficiency and minimize costs.
📖 Complete Guide: See the Database Storage Guide for comprehensive tutorials, advanced usage, and real-world examples.
eyeris organizes preprocessed data using a BIDS-like
directory structure that supports both monocular and binocular
eye-tracking data. The bidsify() function creates a
standardized directory hierarchy with separate organization for
different data types.
For single-eye recordings, data are organized in the main eye directory:
bids_dir/
└── derivatives/
    └── sub-001/
        └── ses-01/
            ├── sub-001_task-test.html
            └── eye/
                ├── sub-001_ses-01_task-test_run-01_desc-timeseries_eye.csv
                ├── sub-001_ses-01_task-test_run-01_desc-confounds.csv
                ├── sub-001_ses-01_task-test_run-01_epoch-stimulus_desc-preproc_pupil.csv
                ├── sub-001_ses-01_task-test_run-01_baseline-stimulus_desc-preproc_pupil.csv
                ├── sub-001_ses-01_task-test_run-01_events.csv
                ├── sub-001_ses-01_task-test_run-01_blinks.csv
                ├── sub-001_ses-01_task-test_run-01_summary.csv
                ├── sub-001_ses-01_task-test_run-01.html
                └── source/
                    ├── figures/
                    │   └── task-test_run-01/
                    │       ├── task-test_run-01_fig-1_deblink.jpg
                    │       ├── task-test_run-01_fig-2_detrend.jpg
                    │       ├── task-test_run-01_fig-3_interpolate.jpg
                    │       ├── task-test_run-01_fig-4_lpfilt.jpg
                    │       ├── task-test_run-01_fig-5_zscore.jpg
                    │       ├── task-test_run-01_gaze_heatmap.png
                    │       ├── task-test_run-01_detrend.png
                    │       └── task-test_run-01_desc-progressive_summary.png
                    └── logs/
└── task-test_run-01_metadata.jsonFor binocular recordings, data are organized into separate
left and right eye subdirectories:
bids_dir/
└── derivatives/
    └── sub-001/
        └── ses-01/
            ├── sub-001_task-test_eye-L.html
            ├── sub-001_task-test_eye-R.html
            ├── eye-L/
            │   ├── sub-001_ses-01_task-test_run-01_desc-timeseries_eye-L.csv
            │   ├── sub-001_ses-01_task-test_run-01_desc-confounds_eye-L.csv
            │   ├── sub-001_ses-01_task-test_run-01_epoch-stimulus_desc-preproc_pupil_eye-L.csv
            │   ├── sub-001_ses-01_task-test_run-01_baseline-stimulus_desc-preproc_pupil_eye-L.csv
            │   ├── sub-001_ses-01_task-test_run-01_events_eye-L.csv
            │   ├── sub-001_ses-01_task-test_run-01_blinks_eye-L.csv
            │   ├── sub-001_ses-01_task-test_run-01_summary_eye-L.csv
            │   ├── sub-001_ses-01_task-test_run-01_eye-L.html
            │   └── source/
            │       ├── figures/
            │       │   └── task-test_run-01/
            │       └── logs/
            │           └── task-test_run-01_metadata.json
            └── eye-R/
                ├── sub-001_ses-01_task-test_run-01_desc-timeseries_eye-R.csv
                ├── sub-001_ses-01_task-test_run-01_desc-confounds_eye-R.csv
                ├── sub-001_ses-01_task-test_run-01_epoch-stimulus_desc-preproc_pupil_eye-R.csv
                ├── sub-001_ses-01_task-test_run-01_baseline-stimulus_desc-preproc_pupil_eye-R.csv
                ├── sub-001_ses-01_task-test_run-01_events_eye-R.csv
                ├── sub-001_ses-01_task-test_run-01_blinks_eye-R.csv
                ├── sub-001_ses-01_task-test_run-01_summary_eye-R.csv
                ├── sub-001_ses-01_task-test_run-01_eye-R.html
                └── source/
                    ├── figures/
                    │   └── task-test_run-01/
                    └── logs/
└── task-test_run-01_metadata.jsonAll files follow a consistent BIDS-like naming pattern:
desc-timeseries_eye
(with _eye-L or _eye-R suffix for binocular
data)desc-confounds (with eye
suffix for binocular data)epoch-{event}_desc-preproc_pupil (with eye suffix for
binocular data)baseline-{event}_desc-preproc_pupil (with eye suffix for
binocular data)events (with eye suffix for
binocular data)blinks (with eye suffix for
binocular data)The events and blinks CSV files contain the raw event markers and blink detection data as stored in the eyeris object:
Events file structure:
block: Block/run numbertime: Timestamp of the eventtext: Raw event text from the ASC filetext_unique: Unique event identifierBlinks file structure:
block: Block/run numberstime: Start time of the blinketime: End time of the blinkdur: Duration of the blink in millisecondseye: Eye identifier (L/R for binocular data)eyeris commands with eyelogger()The eyelogger() utility lets you run any
eyeris command (or block of R code) while automatically
capturing all console output and errors to timestamped log files. This
is especially useful for reproducibility, debugging, or running batch
jobs.
How it works:
stdout) and standard error
(stderr) are saved to log files in a directory you specify
(or a temporary directory by default).<timestamp>.out: all console output<timestamp>.err: all warnings and errorsYou can wrap any eyeris command or block of code in
eyelogger({ ... }):
library(eyeris)

# log a simple code block with messages, warnings, and prints
eyelogger({
  message("eyeris `glassbox()` completed successfully.")
  warning("eyeris `glassbox()` completed with warnings.")
  print("some eyeris-related information.")
})

# log a real eyeris pipeline run, saving logs to a custom directory
log_dir <- file.path(tempdir(), "eyeris_logs")
eyelogger({
  glassbox(eyelink_asc_demo_dataset(), interactive_preview = FALSE)
}, log_dir = log_dir)eyeris_cmd: The code to run (wrap in {}
for multiple lines).log_dir: Directory to save logs (default: a temporary
directory).timestamp_format: Format for log file names (default:
"%Y%m%d_%H%M%S").After running, you’ll find log files in your specified directory, e.g.:
20240614_153012.out   # console output
20240614_153012.err   # warnings and errors
This makes it easy to keep a record of your preprocessing runs and debug any issues that arise.
eyeris dependency graph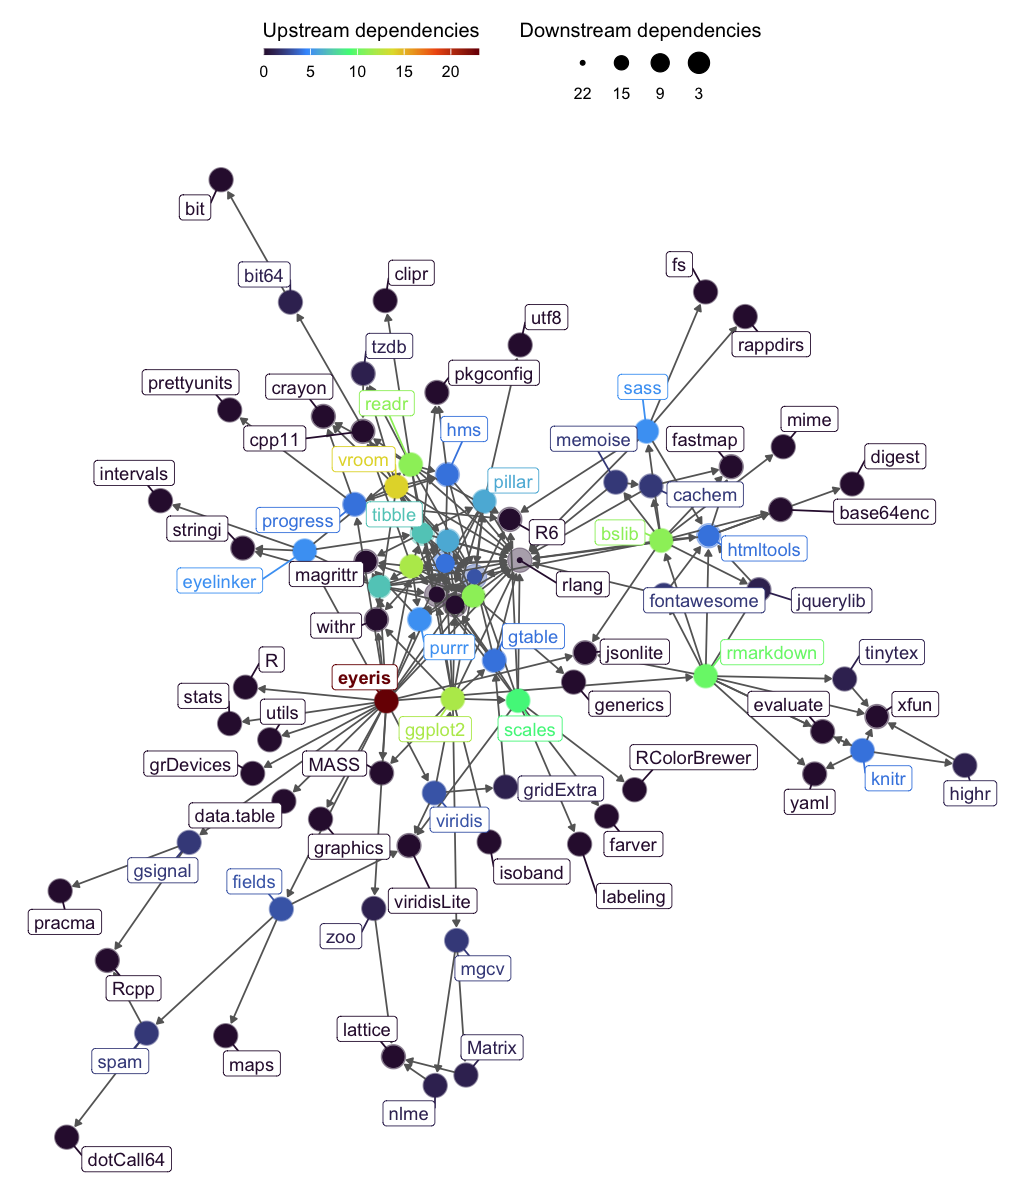
eyerisThank you for considering contributing to the open-source
eyeris R package; there are many ways one could contribute
to eyeris.
We believe the best preprocessing practices emerge from collective expertise and rigorous discussion. Please see the contribution guidelines for more information on how to get started..
Please note that the eyeris project is released with a Contributor Code of Conduct. By contributing to this project, you agree to abide by its terms.
Please use the issues tab (https://github.com/shawntz/eyeris/issues) to make note of any bugs, comments, suggestions, feedback, etc… all are welcomed and appreciated, thanks!
eyerisIf you use the eyeris package in your research, please
consider citing our preprint!
Run the following in R to get the citation:
citation("eyeris")
#> To cite package 'eyeris' in publications use:
#>
#>   Schwartz ST, Yang H, Xue AM, He M (2025). "eyeris: A flexible,
#>   extensible, and reproducible pupillometry preprocessing framework in
#>   R." _bioRxiv_, 1-37. doi:10.1101/2025.06.01.657312
#>   <https://doi.org/10.1101/2025.06.01.657312>.
#>
#> A BibTeX entry for LaTeX users is
#>
#>   @Article{,
#>     title = {eyeris: A flexible, extensible, and reproducible pupillometry preprocessing framework in R},
#>     author = {Shawn T Schwartz and Haopei Yang and Alice M Xue and Mingjian He},
#>     journal = {bioRxiv},
#>     year = {2025},
#>     pages = {1--37},
#>     doi = {10.1101/2025.06.01.657312},
#>   }